
COVID-19 surges in the USA, Mexico, and Canada
The public health approach to a high rate of coronavirus disease 2019 (COVID-19) cases has often been responsive, with increased control measures following rather than preceding epidemic surges. This was evident during the summer of 2021, when vaccination rates were increased in the southern US states only after high case rates were experienced. Preventive measures may be more effective if applied earlier based on credible forecasts.
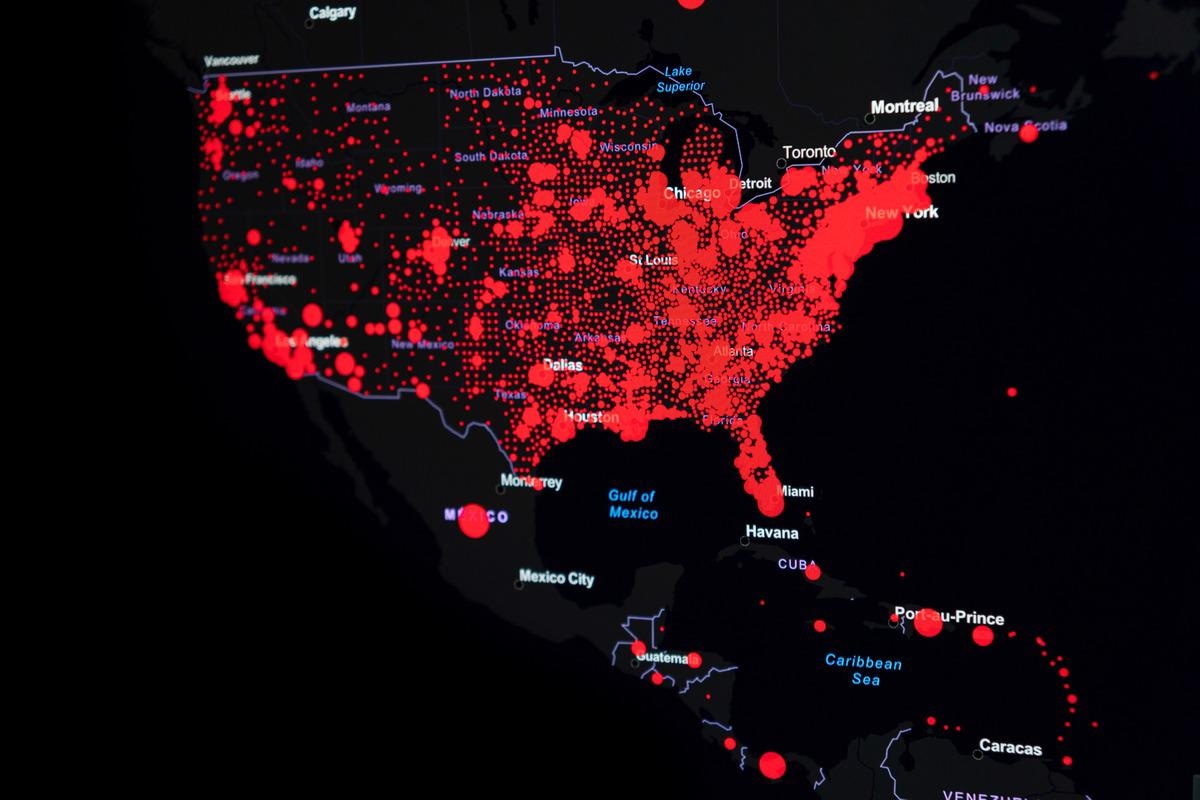 Study: Recurring Spatiotemporal Patterns of COVID-19 in the United States. Image Credit: AnnaMedia/Shutterstock
Studies have shown that the incidence of COVID-19 in the United States has waxed and waned several times since the emergence of the pandemic, generating wave-like spatiotemporal patterns. In a previous study, researchers used data until May 3, 2021, and predicted that a summer wave in 2021 similar to the one in 2020 might occur in the southern states.
In the current study, the authors increased the range of the analysis period through October 31, 2021, and defined spatiotemporal clustering of case time series. The characterization of these patterns may help understand the disease dynamics, aid in forecasting future surges, and facilitate improved targeting of public health resources.
About the study
In this pre-print study published in the medRxiv* server, the authors analyzed the waxing and waning patterns (“surges”) of reported severe acute respiratory syndrome coronavirus 2 (SARS-CoV-2) cases from January 1, 2020, through October 31, 2021, in all states and provinces (n = 93) in the USA, Mexico, and Canada, and across all counties (N = 3142) in the USA. Both the New York Times and John Hopkins University COVID-19 data repositories were used to obtain the daily COVID-19 incidence rates for Canada, the US, and Mexico.
The authors measured the correlation in case rates between each date and every other date across states to examine periodicity in COVID-19 incidence in the USA. Also, a spatiotemporal hotspot progression was animated using the Getis-Ord Gi method to disclose the progression of COVID-19 hotspots over time. To analyze the transmission of each COVID-19 wave in North America, the authors produced a time-lapse movie of daily case incidence at the state and province level in Canada, the USA, and Mexico.
Results
A “checkerboard” pattern was generated due to the correlation matrix of the 576 x 576 daily case incidence rates in the 50 US states. This pattern showed that the epidemic consisted of seven distinct internally coherent spatiotemporal wave patterns – four in the first year of the epidemic and three thus far in the second year.
Geoclustering of state case rate trajectories reveals three dominant co-varying spatial clusters of similar case rate trajectories in the northeastern, southeastern, and central/western regions of the USA. The data showed a repetition of first-year spatiotemporal patterns in the second year of the epidemic.
The “checkerboard” pattern of the correlation matrix of case trajectories was simulated as three sets of interacting sine waves with annual frequencies of 1:1:2 major cycles per year, corresponding to the northeastern, central/western, and southeastern state clusters. The results showed that the case incidence patterns in Mexico and Canada were similar to nearby regions in the southern US and the northern US, respectively.
Furthermore, time-lapse videos permitted the visualization of the wave patterns. The analysis showed that the highly structured geographical and temporal patterns of waxing and waning of COVID-19 are driven at least in part by predictable seasonal factors.
In conclusion, the localized human behavioral factors are often responsible for the waxing and waning of local COVID-19 rates. Besides the seasonal factors, other epidemic factors such as vaccine coverage rates or the emergence of new strains like the SARS-CoV-2 Delta variant also play a crucial role. The seasonal transmission patterns of the virus are associated with seasonal weather patterns. The predictability of these patterns may facilitate forecasting the epidemic and guide public health preparedness and control efforts.
Limitations
There are a few limitations to this study. There were some inconsistencies and biases in reporting the cases across different states and provinces. Also, the fluctuation of the number of tests administered affected the reported incidence. It was not possible to determine the influence of seasons on COVID-19 incidence.
This analysis shows that patterns of waxing and waning of COVID-19 incidence at the state and county level are driven by continental-scale seasonal and geographical patterns.”
*Important notice
medRxiv publishes preliminary scientific reports that are not peer-reviewed and, therefore, should not be regarded as conclusive, guide clinical practice/health-related behavior, or treated as established information.
-
Hawre Jalal, Kyueun Lee, Donald S. Burke. Recurring Spatiotemporal Patterns of COVID-19 in the United States. medRxiv. doi: https://doi.org/10.1101/2021.11.23.21266775 https://www.medrxiv.org/content/10.1101/2021.11.23.21266775v1
Posted in: Medical Science News | Medical Research News | Disease/Infection News
Tags: Coronavirus, Coronavirus Disease COVID-19, Pandemic, Public Health, Respiratory, SARS, SARS-CoV-2, Severe Acute Respiratory, Severe Acute Respiratory Syndrome, Syndrome, Vaccine, Virus

Written by
Saurabh Chaturvedi
Saurabh Chaturvedi is a freelance writer from Jaipur, India. He is a gold medalist in Masters in Pharmaceutical Chemistry and has extensive experience in medical writing. He is passionate about reading and enjoys watching sci-fi movies.
Source: Read Full Article